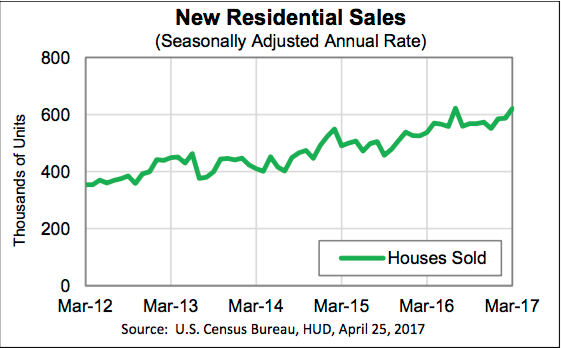
March continued the upward trend of new home sales seen at the start of 2017, just a thousand units shy of July 2016’s sales record. This is according to the U.S. Census Bureau and HUD’s latest statistics that recorded gains in new home sales, supply of for-sale new homes, and median home prices.
Rising New Home Sales
Last month marks the third consecutive month that new home sales grew. As seasonally adjusted, March recorded 621,000 new home sales, a 5.8% increase from February’s 587,000 units and a 15.6% increase from a year ago’s 537,000 units.
In March, the South region had the highest number of new home sales with 323,000 units, followed by the West with 175,000 units, the Midwest with 84,000 units, and the Northeast with 39,000 units.
If not seasonally adjusted, there were 58,000 new homes sold during the relevant period compared to 48,000 unit sales in February.
March’s new home sales data matched with a higher volume of new home purchase mortgage applications during the end of the month.
By the end of March, 268,000 new home units were up for sale. This number represented a 1.1% increase from 265,000 units for sale by the end of February, and a 9.8% increase from an inventory of 244,000 units back in March 2016.
March’s for-sale inventory represented a supply of 5.2 months at the current sales rate.
Rising Home Prices
The median sales price in March was $315,100, up from $293,100 in February. New homes sold at an average price of $388,200.
The rise in home prices is monitored by the S&P CoreLogic Case-Shiller U.S. National Home Price NSA Index, which showed an annual gain of 5.8% in February compared to January’s 5.6% gain. This is a fourth consecutive all-time high for the index that tracks home prices in all nine census divisions in the US.
Per the S&P/CoreLogic Index, the city of Seattle led the pack of cities with the highest increases in home prices with 12.2%; Portland came in second with a 9.7% gain and third is Dallas with 8.8%. Fifteen other cities also recorded home price increases through February 2017.
A separate report from Black Knight revealed that its Home Price Index reached a new post-crisis peak in February of $268,000. This represented a year-over-year increase in home prices of 5.7% and an increase of 1% since the beginning of 2017. The HPI is a micro-level valuation of nearly 90% of U.S. residential properties.


