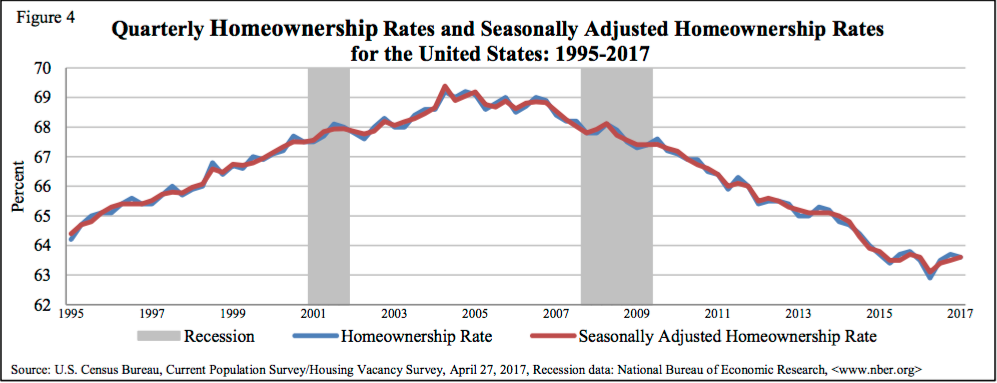
On the surface, the national homeownership rate for the first quarter of 2017 held steady as in the first and fourth quarters of 2016. But the good news lies in 854,000 owner-occupied households created during the relevant quarter, according to the latest Housing Vacancy Survey by the U.S. Census Bureau.
First-Quarter Homeownership Rate, Housing Inventory in the U.S.
For the first quarter of 2017, the homeownership rate in the U.S. stood at 63.6%. As the Bureau would have it (referring to the survey’s margin of error), 1Q17’s rate was not statistically different from 63.5% in 1Q16 and 63.7% in 4Q16.
About 87.3% of all housing units in the U.S. were occupied and the rest (12.7%) were vacant during the first quarter of 2017.
At 1Q17, there was an estimated 136,090 in total housing inventory, up from a year ago’s total housing units of 135,268. This means 822,000 housing units more were available during the first quarter of 2017.
Moreover, the number of owner-occupied homes in 1Q16 was 74,702 vis-a-vis 75,7556 owner-occupied housing units in 1Q17. This resulted in the creation of 854,000 homes that were owner-occupied during the first quarter of 2017. Compare this to 365,000 renting households formed in the same period (the difference between 1Q16’s 42,879 and 1Q17’s 43,244 rental household estimates).
The Bureau’s estimates, which are based on Vintage 2015 housing controls, can change as data on building permits, housing loss, and other admin records come in.
Profile of Homeowners
The first-quarter homeownership rate, if broken down into age, region, and ethnicity, is as follows:
- Homeownership was strongest in the age group of 65 years old and above, clinching 78.6% and it was lowest among those under 35 years old with 34.3%.
Homeownership was highest among non-Hispanic Whites with 71.8%, followed by Asians, Native Hawaiians and Pacific Islanders with 56.8% and Blacks with 42.7% as the lowest.
Homeownership was highest in the Midwest at 67.6%, second is the South at 65.4%, third is the Northeast at 60.6% and last is the West at 59.0%.
Other First Quarter 2017 Highlights
- Median asking price for vacant for-rent units was $864.
- Median asking price for vacant for-sale units was $176,900.
- The national homeowner vacancy rate – the proportion of homeowner housing inventory that is vacant for sale – was 1.7%, (i) virtually unchanged in 1Q16 and (ii) down from 1.8% in 4Q16.
- The 1Q17 national rental vacancy rate – the ratio of rental housing unit that is vacant for rent – was 7.0%, (i) unchanged in 1Q16 and (ii) statistically not different from 6.9% in 4Q16.
The Census Bureau’s Housing Vacancy Survey contains current information on homeownership rates on the national, regional, state, and MSA levels, as well as the number and nature of rental and homeowner housing units available for occupancy.


